 CleanLink Interactive Spring/Summer 2026 Issue
 Recognizing the 2026 Reader Choice Award Winners
 2026 Emerging Leader Award
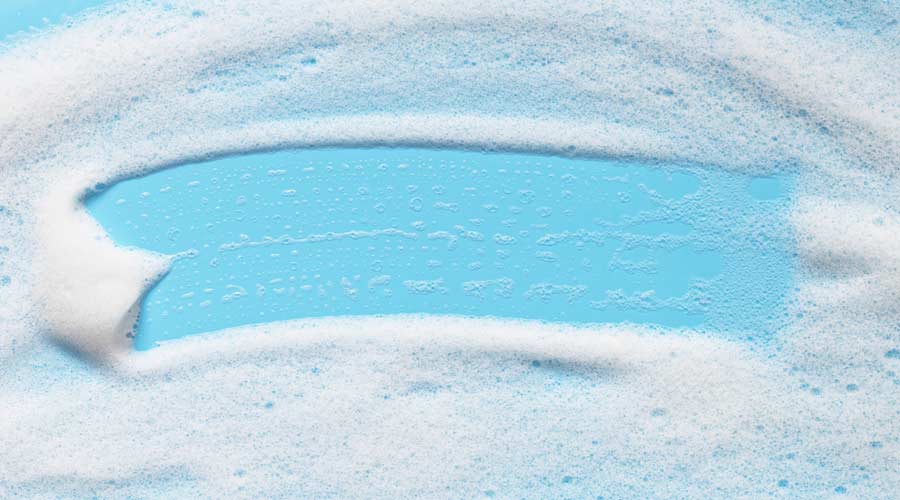 How Surfactant Use is Expanding in Commercial Cleaning
Benchmarking has become an oft-used buzzword in the cleaning industry. Many proponents believe that identifying the highest standards of excellence, and adapting and applying them to an operation will improve performance. But benchmarking can yield undesired results, if not used properly by a trained technician in the appropriate situations.
Companies such as Kodak, Motorola and Xerox have been successful with benchmarking in areas of machine reliability, reengineering business processes and lead time reductions. But while benchmarking can help increase efficiency in mass production, it’s much harder to use guidelines developed for one housekeeping department’s processes to streamline another, very different operation.
Most often, benchmarking has a more negative effect when housekeeping executives fail to consider all the necessary factors involved than if they’d never tried the process at all.
The most important step in using any improvement tool is to first know what you are doing now. Knowing your facilities, your methods, your staffing, and your goals are critical in measuring and improving your operation. It only makes sense to know where you are and where you want to go before starting the trip.
Addressing common mistakes
The process of benchmarking typically involves seven steps, each of which must be completely finished prior to moving to the next. If something is not completed before moving on, or is incorrect, supervisors could be working with incomplete data, making incorrect assumptions or demanding more of their staffs than possible. These steps are:
- Determine what functions to benchmark.
- Define appropriate metrics.
- Identify best practice companies.
- Measure own and best practice performance.
- Estimate performance gaps and set goals.
- Implement improvement plan.
- Monitor results.
Typically, cleaning is the function under examination and cost-per-gross-square-foot, per year, is the metric. But this is too broad of a scope with too many variables and assumes a similar quality level that may not exist.
Many organizations also attempt to benchmark cleaning for the purpose of reducing cost and increasing efficiency. This too can be misguided. For example, XYZ University has a $0.75 cost-per-gross-square-foot-per-year while ABC University is at $0.85, so $0.75 becomes the best practice ABC must strive for.
This assumption then requires large amounts of research to identify the many possible differences in facilities, access, practices, procedures, productivity and quality — most of which could show that ABC University realistically cannot meet that lower cost. Frustration then builds in the organization and results in reduced frequencies and staffing as the only way to achieve the unrealistic goal — all at the sacrifice of quality.
Done right
To make a true benchmarking comparison, housekeeping executives must consider multiple functions, varying levels of frequency, geographic differences, a variety of floor finishes, traffic factors, age of facilities and people components. It is unreasonable to expect to compare cleaning as a function unless all of these areas are equal.
Further, the amounts and type of carpeting, resilient tile, concrete and other types of flooring will impact method, frequency and cleaning costs. Number, size and placement of janitor closets along with entrance configuration and amount of walk-off space also must be compared.
Next, housekeeping directors must consider the type and number of people utilizing the building, whether they carry food and drink with them, what activities they perform, and when and how long they are in the building. Additionally, there are differences among union, in-house or contractor’s employees; whether they are properly trained; whether they are part-time or full-time; if they are productive; and what they are paid in wages and benefits.
Another pitfall many executives encounter is the variance in peoples’ definitions of “cleanable space.” Gross-square-foot with consideration for population density and/or traffic would be a more legitimate metric.
Next, proper benchmarking requires an understanding of what constitutes cost. Are labor, cleaning supplies, equipment, paper towels and tissue, matting and liners included?
Some facilities also vary in what tasks they consider housekeeping’s jobs versus maintenance work; that can make a difference. Projects done every few years, such as cleaning light fixtures or draperies also count.
Once all these factors are accounted for, the next step in benchmarking is looking at the subjectivity of rating cleaning quality levels.
The best set quality levels that housekeeping executives can use consistently are those set by industry organizations. For instance, carpet cleaning can use the Carpet and Rug Institute (CRI) appearance retention grading scales for various types of carpeting. This will establish quality and set the metric of cost-per-square-foot-per-year. Best practices could then be determined and performance could be measured by examining cleaning method, labor, frequency, and equipment and chemical selection. Within these parameters, benchmarking will be accurate.
An alternative
Unfortunately, it is not always possible in cleaning to separate functions in terms of costs or quality for comparison. For organizations unable to do so, benchmarking may not be their best tool for improvement.
A better choice for many housekeeping departments might be a more focused process improvement tool, which involves understanding all aspects of a single process staff must complete and introducing changes to achieve quality improvement or cost reduction in that isolated area.
General comparisons of cost-per-gross-square-foot can be used as a loose springboard into more specific process improvements.
The steps involved are:
- Process analysis
- Improvement identification
- Process change introduction
- Process change training
- Change tuning
Process analysis is the in-depth study and understanding of processes currently used in a housekeeping department, including facility data, staffing, methods, frequency, chemicals and equipment:
Facility data includes specific square footage of floor coverings, number of restrooms, number of fixtures, number and square footage of offices, conference rooms, and break areas.
Staffing is not only the number of cleaning people in the department but the population of the building, hours of operation and types of activity.
Methods encompass choices such as use of area cleaning, team cleaning, daytime cleaning, and dry or wet cleaning of carpet.
Frequency is affected by the quality level chosen, the higher the quality standard the higher the frequency.
Chemicals have dilution ratios, coverage data, hazards, application specifics, drying times and performance limits.
Equipment data includes productivity data, maintenance requirements, performance expectations, replacement and cost.
Once this is gathered, areas of improvement must be identified. The changes necessary may be in any or a combination of several of the cleaning aspects such as cleaning methods or chemical and equipment selection.
The process change or changes then need to be introduced in a pilot area or areas to develop procedures and training. This allows time for evaluation and modification of application and training procedures.
Next, all personnel should receive training on a planned schedule utilizing either specialized training personnel or pilot participants.
The final step is monitoring the change and fine-tuning as needed. Monitoring for quality should be done as part of the existing quality-control program schedule. Monitoring cost can be incorporated into monthly review of expenses and annual budgeting processes.
Steven Spencer, Cleaning and interior maintenance senior specialist for State Farm Insurance