 Celebrating BSCAI's 60th Anniversary eBook
 Recognizing the 2026 Reader Choice Award Winners
 2026 Emerging Leader Award
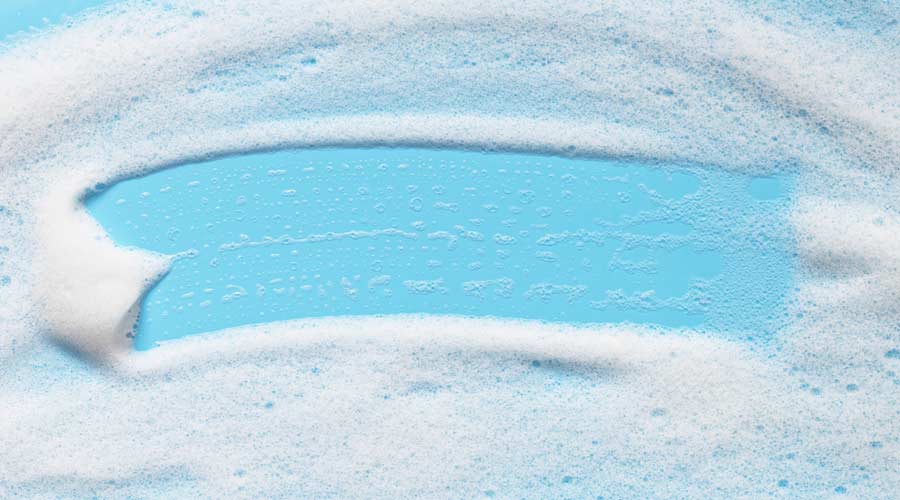 How Surfactant Use is Expanding in Commercial Cleaning
 Boost Cleaning Efficiency and Sustainability in Just 40 Minutes

2006 Report on Sanitary Supply Distributor Sales
Results of a joint research study conducted by Sanitary Maintenance magazine and ISSA
About the Study...
This study was designed, prepared and conducted by the Research Department of Trade
Press Publishing Corporation, publisher of Sanitary Maintenance Magazine in conjunction
with the ISSA. Its primary purpose was to gather information on distributor sales of
chemicals, janitorial supplies, paper/plastic products and power equipment. The data
contained within this report is believed to be reflective of the janitorial supply distribution
industry and does not necessarily reflect the size of each market segment or product group
beyond that. Data shown in this report was derived from non-duplicated questionnaires
returned by April, 2007 from a random sample of Sanitary Maintenance readers which
includes ISSA members. Projected market totals were computed using weighted means.
Dollar figures presented represent sales by distributors after markup. Estimates for
manufacturer sales based on these figures are difficult to make since markup varies from
category to category and from one distributor to another.
2006 Distributor Sales Volume
| TOTAL SALES | $24,815,000,000 | Percentage of Total |
| Paper/Plastics | $11,597,000,000 | 46.8% |
| Chemicals | $8,119,000,000 | 32.7% |
| Supplies, Accessories | $2,547,000,000 | 10.3% |
| Power Equipment | $1,970,000,000 | 7.9% |
| Other Janitorial Products | $582,000,000 | 2.3% |
| 2006 Distributor Sales by Market Segment | ||
| Industrial (manufacturing plants, food processing, utilities, warehouses) | $3,449,285,000 | 13.9% |
| Educational (schools, colleges, universities) | $3,225,950,000 | 13.0% |
| Contract Cleaners | $3,201,135,000 | 12.9% |
| Commercial (office buildings, property management firms) | $3,101,875,000 | 12.5% |
| Governmental (municipal, county, state, federal) | $2,456,685,000 | 9.9% |
| Health Care (hospitals, nursing homes, clinics, medical and dental offices) | $2,431,870,000 | 9.8% |
| Hotels/Motels | $1,662,605,000 | 6.7% |
| Retail (grocery, shopping malls, department stores, auto dealers, etc.) | $1,612,975,000 | 6.5% |
| Restaurants/Clubs (stand-alone, country clubs) | $1,513,715,000 | 6.1% |
| Recreation (stadiums, health clubs, movie theaters, casinos, bowling alleys) | $942,970,000 | 3.8% |
| Transportation (airports, public transit, airlines, bus and rail stations) | $595,560,000 | 2.4% |
| Residential (apartment buildings, condominiums) | $322,595,000 | 1.3% |
| Religious (churches, convents, etc., EXCLUDING hospitals & schools) | $297,780,000 | 1.2% |
| Total | $24,815,000,000 |
Breakdown of 2006 Product Sales
| 2006 Chemical Sales | $8,119,000,000 | (32.7%) |
| Bench Products (lubricants, solvents, parts cleaner, cutting fluids) | $219,213,000 | 2.7% |
| Bio Enzymes (drain opener, drain cleaner, etc.) | $316,641,000 | 3.9% |
| Carpet Care Chemicals (shampoos, pretreats, spotters, etc.) | $600,806,000 | 7.4% |
| Cleaners & Degreasers (glass, wall, counter, other surfaces) | $1,120,422,000 | 13.8% |
| Disinfectants & Sanitizers (bowl, porcelain, counter, other surfaces) | $909,328,000 | 11.2% |
| Hand Cleaners (bar, liquid, powder, etc.) | $884,971,000 | 10.9% |
| Ice Melts | $316,641,000 | 3.9% |
| Insecticides, Herbicides & Pesticides | $56,833,000 | 0.7% |
| Laundry Detergents | $332,879,000 | 4.1% |
| Odor Control (blocks, liquids, gels) | $357,236,000 | 4.4% |
| Pool/Spa Care Products | $8,119,000 | 0.1% |
Resilient & Hard Floor Chemicals (strippers, neutralizers, sealers, |
$2,435,700,000 | 30.0% |
| Warewash Chemicals | $340,998,000 | 4.2% |
| Water Treatment Chemicals | $8,119,000 | 0.1% |
| Other Chemicals not listed above | $211,094,000 | 2.6% |
| Total | $8,119,000,000 |
| 2006 Power Equipment Sales | $1,970,000,000 | (7.9%) |
| Automatic Scrubbers | $374,300,000 | 19.0% |
| Battery Powered Floor Machines (polishers, burnishers) | $82,740,000 | 4.2% |
| Carpet Extractors | $234,430,000 | 11.9% |
| Electric (Corded) Powered Floor Machines (polishers, burnishers) | $238,370,000 | 12.1% |
| Pressure Washers (NOT including restroom cleaning machines) | $41,370,000 | 2.1% |
| Propane Powered Floor Machines | $37,430,000 | 1.9% |
| Power Sweepers | $65,010,000 | 3.3% |
| Replacement Parts | $299,440,000 | 15.2% |
| Restroom Cleaning Machines (NOT including pressure washers) | $49,250,000 | 2.5% |
| Ultrasonic Cleaners | $23,640,000 | 1.2% |
| Vacuums (backpack) | $86,680,000 | 4.4% |
| Vacuums (tank and wet/dry) | $76,830,000 | 3.9% |
| Vacuums (upright, wide area) | $323,080,000 | 16.4% |
| Other Power Equipment not listed above | $37,430,000 | 1.9% |
| Total | $1,970,000,000 |
| 2006 Supplies, Accessories | $2,547,000,000 | (10.3%) |
| Absorbents, Spill Containment | $50,940,000 | 2.0% |
| Brooms & Brushes | $264,888,000 | 10.4% |
| Dusters & Dust Mops, & Applicator Pads (EXCLUDING microfibers) | $142,632,000 | 5.6% |
| Floor Pads | $213,948,000 | 8.4% |
| Floor Machine Brushes | $48,393,000 | 1.9% |
| Gloves (light weight, disposable & safety) | $318,375,000 | 12.5% |
| Hand Tools (scrapers, screwdrivers, pliers, hammers, flashlights, etc.) | $33,111,000 | 1.3% |
| Mats & Matting | $305,640,000 | 12.0% |
| Microfiber Products (mops, clothes, etc.) | $152,820,000 | 6.0% |
| Wet Mops (all types, EXCEPT microfiber) | $219,042,000 | 8.6% |
| Mopping Equipment (buckets, wringers, etc, NOT mops) | $241,965,000 | 9.5% |
| Protective clothing (ear plugs, eye care, masks, safety glasses, etc., NOT gloves) |
$30,564,000 | 1.2% |
| Safety Products & Equipment (back supports, cleanup kits, first aid kits, safety treads, etc.) |
$48,393,000 | 1.9% |
| Signage, barricades | $48,393,000 | 1.9% |
| Squeegees | $38,205,000 | 1.5% |
| Touch-Free Washroom Fixtures (hand dryers, dispensers, flush valves) | $61,128,000 | 2.4% |
| Traditional Washroom Fixtures (non touch-free hand dryers, dispensers) |
$76,410,000 | 3.0% |
| Warewashing Equipment | $22,923,000 | 0.9% |
| Waste Handling Equipment (carts, receptacles, NOT liners) | $155,367,000 | 6.1% |
| Window Washing Accessories (buckets, holsters, etc., NOT squeegees) | $38,205,000 | 1.5% |
| Other Supplies, Accessories not listed above | $35,658,000 | 1.4% |
| Total | $2,547,000,000 |
| 2006 Paper/Plastic Sales | $11,597,000,000 | (46.8%) |
| Foodservice Disposables (napkins, plates, bowls, cups, cutlery, wraps) | $1,925,102,000 | 16.6% |
| Industrial Wipers | $429,089,000 | 3.7% |
| Liners & Bags (paper or plastic) | $2,110,654,000 | 18.2% |
| Packaging Products | $1,785,938,000 | 15.4% |
| Towels, Facial Tissue, Toilet Tissue | $5,230,247,000 | 45.1% |
| Other Paper/Plastics not listed above | $115,970,000 | 1.0% |
| Total | $11,597,000,000 |
2006 Other Janitorial Products Not
Listed in Any Preceding Category - $582,000,000 (2.3%)
Additional Sales information
| 2006 Average Gross Margin | |
| Chemicals | 41.4% |
| Power Equipment | 33.3% |
| Supplies, Accessories | 32.2% |
| Paper/Plastics | 28.2% |
| Miscellaneous Products | 24.3% |
| Average Number of Salespeople Employed | |
| Outside Salespeople | 8 |
| Inside Salespeople | 4 |
| Source of Orders | |
| Verbal phone | 40% |
| Verbal in Person | 27% |
| Fax |
19% |
| Internet | 7% |
| Standing order | 4% |
| Other | 3% |